Saturday, February 23, 2013

Absolute Zero

In this experiment, my goal was to find the temperature of absolute zero. To do this I heated a beaker to 70°C, in a vat of water, and then placed a cork in the beaker. Running through this beaker was a piece of tubing attached to a pressure gage. The pressure gage was simply a U of glass tubing, filled with mercury, held up on a stand. One end of the U was attached to the tube coming from the beaker; the other end was open to the atmosphere. Therefore, the measurements I would be making would be mm of mercury difference between the pressure inside the beaker and pressure outside the beaker. Later, I could correct the measurements to pascals. As the temperature of the water the beaker was submerged in dropped so too did the pressure inside the beaker. This can easy be explained by looking at the ideal gas equation (Equation 1). Because the beaker is sealed the volume and number of moles of gas cannot change, and the molar gas constant is a constant so it cannot change. Therefore, the only thing that can change when the temperature is lowered is the pressure.

Equation 1. This is the ideal gas equation. It functions only if the molecules have elastic collisions. P = pressure in pascals. V = the volume the gas is takes up.  n = the number of moles of gas that are present. R = the molar gas constant (≈8.3145 J/(mol K)). T = the temperature in Kelvin.

I took temperature and pressure readings about every 5 to 8 degrees of temperature change (Table 1). I then converted the mm of mercury to pascals by finding out how many pascals it took to move the mercury one mm (1mm of mercury = 133.322368 pascals), multiplying the number of mm by the number of pascals per mm. This only gave me the pressure differences. To find actual pressure in the beaker I subtracted the difference from the pressure in the room (99,700pa). I then plotted the data points on a graph (Figure1) and fitted a trend line to it, using Excel trend line. To find absolute zero I had to find the point at which the pressure was equal to zero. The reason behind this is at absolute zero all motion of molecules stops, and if the molecules are not moving, there is no way of them exerting pressure. Therefore, 
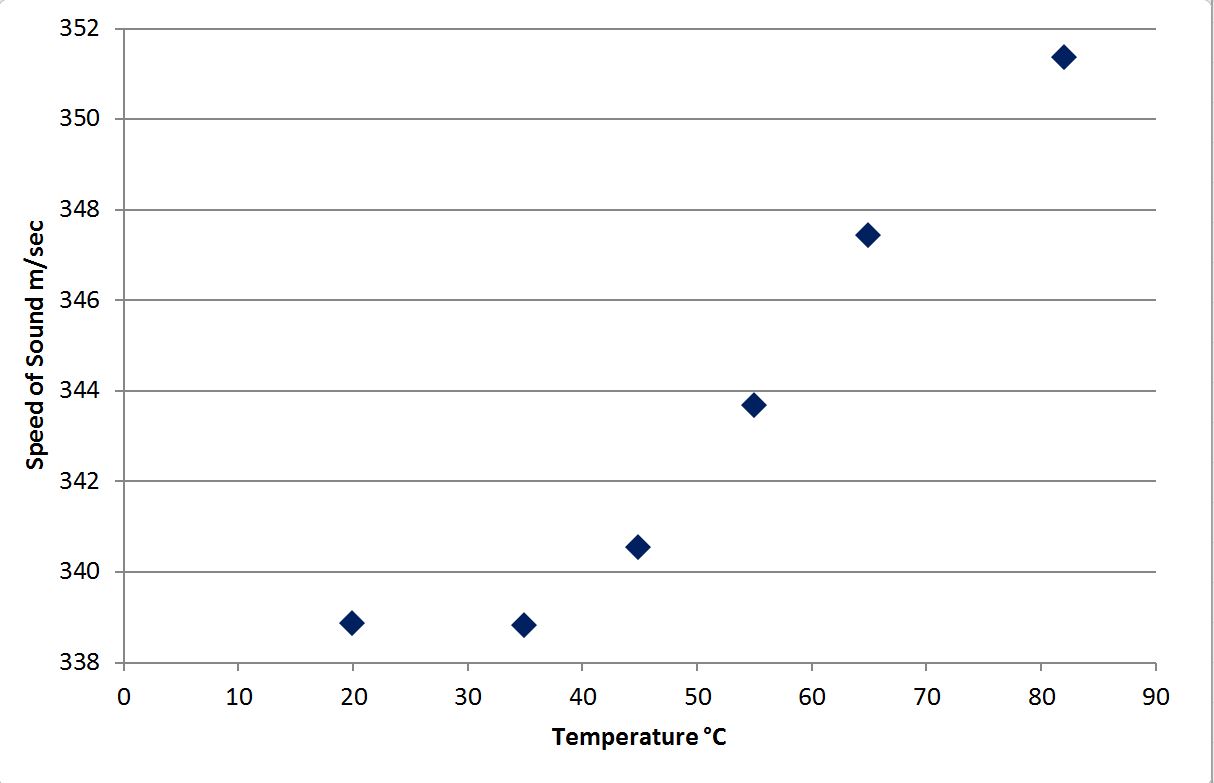
at absolute zero there is zero pressure. Figure 1 is a graph that plots pressure vs temperature. It is a graph that I fit a trend line to and used it to find the temperature of absolute zero.

Figure 1. This graph shows all of the data I collected on the run from 70°C to 0°C. Excel fit the trend line.
After solving for temperature when the pressure is zero I found absolute zero to be -668 °C . The real temperature of absolute zero is -273.15°C.  I was off by about 5°C and I was amazed by how close to the real number I got.

I did a second run of the experiment, this time using liquid nitrogen to cool down the beaker. I was able to get the gas inside the beaker to -100°C. However, the data I collected for this run was not very good. The reason for this was the liquid nitrogen cooled the beaker so fast it was difficult to get accurate simultaneous temperature and pressure measurements. This can be seen by looking at the plot of the data in Figure 2. I fitted a trend line to the data and got a temperature for absolute zero of -218°C. By looking at Figure 2 you can understand why the trend line is so off, the data was not as linear as in the first run.


Figure 2. This graph shows all of the data I collected on the run from 20°C to -100°C. The trend line was fitted by Excel.

Over all this was a really cool experiment.  It was simple but you could find some really interesting data with it. Being able to find the temperature of absolute zero after three hours in the lab was awesome.

-Kyle


Friday, February 22, 2013

Speed of Sound

In this experiment, I attempted to measure the speed of sound. This was done using a long pipe with a speaker  at   and a receiver at the other. The speaker was hooked up to a pulse generator and the receiver to an oscilloscope. To measure the time it took the sound wave from one end to other the distances between the pulse and the receiver picking up the wave would be measured. This gave me the time; to find the distance I just measured the length of the tube. With both of these measurements I could easily find the speed the sound wave was traveling. After recording the speed of sound at room temperature, I began to heat the pipe via the  heating element installed inside it. I took measurements as the temperature increased at ten degree intervals. I found as the temperature in the pipe increased the speed of sound also increased. After this I allowed the pipe to return to room temperature, then added helium to the pipe and took measurements again. The speed of sound increased as more helium was added. I plotted my temperature vs speed in Figure 1. If the helium run had been done with the pipe completely full of helium it would have been  possible to use the ideal gas law and convert all of the measurements into moles of gas and use that on the graph  instead of temperature. However since I had no plans to do I full write up on this lab I did not completely fill the tube with helium. What do both high temperature air and helium have in common? They both have more energy than air at room temperature. This means the molecules are moving faster and therefore are able to transfer the shock wave from the sound quicker. Just for reference, the speed of sound according to Google is 340.29 m/s at sea level which Squeamish is close to.


Figure 1. This figure shows the speed of sound vs temperature. It shows that as the temperature increases so does the speed of sound.

While quantifying how the speed of sound changes depending on the amount of energy the molecules of the gas have. I have to say the best part of my day was getting to play with an oscilloscope, pulse generator, 480-watt power supply, and a Milwaukee Laser Temp-Gun. It was amazing to see everything the oscilloscope can do. The power that instrument has is amazing. It is really only limited by how much time you spend learning  how to use it.
-Kyle

Wednesday, February 20, 2013

Crude Oil Distillation

Today I did the Crude Oil Distillation experiment. In this experiment, crude oil is placed in a beaker and a Bunsen burner placed underneath it.  The crude oil is then heated until white smoke is seen filling the container. This smoke  exits the container via a condenser and is captured in a test tube.


One of the things that I found interesting about this lab was the fact that there were distinct temperatures at which the white gas clouds form. I would apply heat to the container for a while and then suddenly the white cloud would appear and the temperature increase would level off until the gas cloud had dissipated. The reason for this is when the white gas cloud appeared it meant the boiling point of one of the molecules in the crude oil had been reached and it was starting to boil off.  When something is boiling the energy being applied to it, in this case the heat, is going into the phase change and therefore is not changing the temperature of the solution or gas.


I found it interesting how the colour of the liquids that boiled off changed as the heat required to boil them increased. If the liquid boiled at a low temperature its colour was almost perfectly clear, however if its boiling point was high the colour of the liquid was very dark. This can be seen in the visual representation of colour vs. boiling point in Figure 1.


Figure 1. This is a visual representation of how the colour changed as the boiling point of the substances increased. The higher the boiling point the darker the colour of the substance.

After I distilled the crude oil into eight different test tubes each marked with its boiling point I attempted to light a small amount of each liquid on fire. I did this using a burn tray and a propane torch. I found the lower the boiling point of the substances the faster and more forcibly it would burn.  The substances with high boiling points I could not even light, despite holding an open flame on them for some time. The results from this experiment are illustrated in Figure 2.


Figure 2. This is a visual representation of my results when I tried to light the different substances I boiled off the crude oil. This graph shows boiling point vs. flammability.

I was amazed at the amount of different compounds I could boil out of crude oil and was surplussed at how easy it was to tell the substances apart by their boiling points.  Out of curiosity, I looked up the boiling point of diesel and found it to be 154°C. It would have been cool to know this while doing the experiment and being able to know when diesel was being produced.

-Kyle

Tuesday, February 19, 2013

Elastic Collisions Experiment


In the video I show the set up I used for the Elastic Collisions Experiment. I had great success and was able to create collisions into immovable objects with only a 1.3% ±0.13% loss of speed. This measurement was found by taking the velocity of the cart before the collision and after the collision, using a photo gate. In the trial the cart would pass through a photo gate, collide with the immovable object and return through the photo gate where its velocity could again be measured. Over the 10 trials (all of the measurements are averages from 10 trials) I ran, the cart would return with 98.7% ±0.13% of the velocity it had before the collision. This was shocking to me.


Next, I ran the experiment with two carts of equal mass, using two photo gates, one to find the velocity of the first cart before the collision and the other to find the velocity of the second cart after the collision. The results were 98.3% ±0.27% of the first cart's speed was transferred to the second.

The next experiment I did was to test the equation of elastic collisions. To do this I made one cart half the mass of the other. I then collided the big cart into the small cart; I calculated the final velocities based on the initial velocity of the first cart. I found that the velocity of cart_1 after the collision was 14% ±3.2% off the calculated values, however this did not surprise me much because the velocity of the cart was greatly reduced and trying to get an accurate reading was difficult. The number that impressed me was the final velocity of cart_2, the calculated velocity is within 2.4% ±0.19% of the measured final velocity.

For the last run, I switched carts so the starting velocity of the big cart was zero and the small cart was being launched at it. This was the best data set I got all day. The results for the measured final velocity vs. the calculated final velocity were 6.3% ±0.89% and the results for the final measured velocity vs. calculated for cart_2 was 0.7% ±0.16%.

Over all this lab was a lot of fun and I was astonished by how close to the calculated final velocity it was possible to get. Playing with something with almost no friction was mind-bending, the carts would bounce off each other for what seemed like forever.

-Kyle

Monday, February 18, 2013

Chemical Energy Experiment 1

Accounting for the heat loss of the container

This is how I accounted for the heat loss of the insulated container used to contain water. After running the experiment with both sodium hydroxide and ammonium nitrate, I repeated the experiment with lithium chloride. Lithium chloride was used because the energy it releases when mixed with water is known and could therefore be used to calibrate the measurement device. This gave me three sets of data, one for each of the chemicals. For each of the data sets I ran three trials. To correct the data, I needed to know the amount of energy unaccounted for by the change in temperature. I used equation 1 to find this number.


Equation 1
E = amount of energy lithium chloride is known to give off when it mixes with water (this number can be found by looking in the CRC Handbook of chemistry of physics.  ∆T = is the change is temperature.  c = specific heat of water. m = the total mass.  q = the amount of energy lost for every degree of temperature change.


I then used equation 2 to find the amount of energy the other chemicals released or absorbed. This equation was used instead of (E=mc∆T) because it corrected for the energy lost to the container.

Equation 2
E = the energy that is released or absorbed. m = total mass. c = specific heat of water. ∆T = is the change is temperature. q = the amount of energy lost for every degree of temperature change (found using equation 1)

-Kyle